Difference between revisions of "Overview of the APE Architecture"
| (One intermediate revision by one other user not shown) | |||
| Line 1: | Line 1: | ||
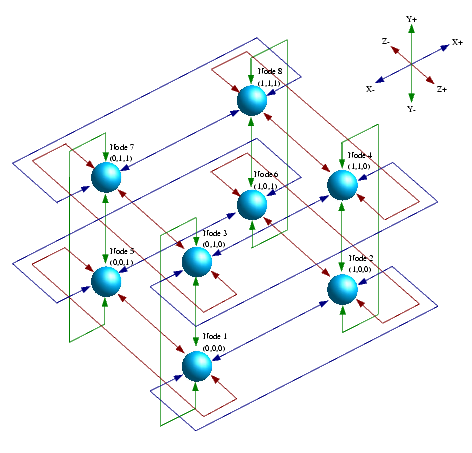
The APE machines are massively parallel 3D arrays of custom computing nodes with periodic boundary conditions. Four generations of APE supercomputing engines have been characterized by impressive value of sustained performances, performance/volume, performance/power and performance/price ratios. The APE group made extensive use of VLSI design, designing VLIW processor architectures with native implementation of the complex type operator performing the AxB+C operation and large multi-port register files for high bandwidth with the arithmetic block. The interconnection system is optimized for low-latency, high bandwidth nearest-neighbours communication. The result is a dense system, based on a reliable and safe HW solution. It has been necessary to develop a custom mechanics for wide integration of cheap systems with very low cost of maintenance. | The APE machines are massively parallel 3D arrays of custom computing nodes with periodic boundary conditions. Four generations of APE supercomputing engines have been characterized by impressive value of sustained performances, performance/volume, performance/power and performance/price ratios. The APE group made extensive use of VLSI design, designing VLIW processor architectures with native implementation of the complex type operator performing the AxB+C operation and large multi-port register files for high bandwidth with the arithmetic block. The interconnection system is optimized for low-latency, high bandwidth nearest-neighbours communication. The result is a dense system, based on a reliable and safe HW solution. It has been necessary to develop a custom mechanics for wide integration of cheap systems with very low cost of maintenance. | ||
| − | + | [[Image:3d-mesh.png|right|frame]] | |
{|align="center" | {|align="center" | ||
|+'''The APE family of supercomputers''' | |+'''The APE family of supercomputers''' | ||
| Line 26: | Line 26: | ||
==Architecture Design Tradeoffs== | ==Architecture Design Tradeoffs== | ||
As pointed before one of the most critical issue for the design of the next generations of high performance numerical applications will be the power dissipation. A typical figure is the power dissipation per unit area. The following picture illustrates the efficiency of the approach adopted by INFN: | As pointed before one of the most critical issue for the design of the next generations of high performance numerical applications will be the power dissipation. A typical figure is the power dissipation per unit area. The following picture illustrates the efficiency of the approach adopted by INFN: | ||
| − | [[Image:APE_power_vs_perf.jpg|500px|left]] | + | [[Image:APE_power_vs_perf.jpg|500px|left]] |
| − | On the other hand the most limiting factor of processing nodes density is the inter-processor bandwidth density. In the traditional approach, used in top computing systems as INFN apeNEXT and IBM BlueGene/L, the inter-processor connections use a 3-D toroidal point-to-point network. In these systems the limiting factor of the density of processing nodes is the connectors’ number and related surface area required to implement such networks. The physical implementation is realized distributing the set of motherboard connectors on its 1-D edge using a backplane to form a multi board system. | + | |
| + | On the other hand the most limiting factor of processing nodes density is the inter-processor bandwidth density. In the traditional approach, used in top computing systems as INFN apeNEXT and [http://www.research.ibm.com/bluegene/ IBM BlueGene/L], the inter-processor connections use a 3-D toroidal point-to-point network. In these systems the limiting factor of the density of processing nodes is the connectors’ number and related surface area required to implement such networks. The physical implementation is realized distributing the set of motherboard connectors on its 1-D edge using a backplane to form a multi board system. | ||
As a consequence the density of processing nodes per motherboard is 16 nodes for apeNEXT and 64 nodes per BlueGene/L, while the density per rack is equal to 512 nodes for apeNEXT and 1024 for BlueGene/L. | As a consequence the density of processing nodes per motherboard is 16 nodes for apeNEXT and 64 nodes per BlueGene/L, while the density per rack is equal to 512 nodes for apeNEXT and 1024 for BlueGene/L. | ||
Latest revision as of 11:20, 10 June 2011
The APE machines are massively parallel 3D arrays of custom computing nodes with periodic boundary conditions. Four generations of APE supercomputing engines have been characterized by impressive value of sustained performances, performance/volume, performance/power and performance/price ratios. The APE group made extensive use of VLSI design, designing VLIW processor architectures with native implementation of the complex type operator performing the AxB+C operation and large multi-port register files for high bandwidth with the arithmetic block. The interconnection system is optimized for low-latency, high bandwidth nearest-neighbours communication. The result is a dense system, based on a reliable and safe HW solution. It has been necessary to develop a custom mechanics for wide integration of cheap systems with very low cost of maintenance.
| APE | APE100 | APEmille | APEnext | |
|---|---|---|---|---|
| Year | 1984-1988 | 1989-1993 | 1994-1999 | 2000-2005 |
| Number of processors | 16 | 2048 | 2048 | 4096 |
| Topology | Flexible 1D | Next Neighbour 3D | Flexible 3D | Flexible 3D |
| Total Memory | 256 MB | 8 GB | 64 GB | 1 TB |
| Clock | 8 MHz | 25 MHz | 66 MHz | 200 Mhz |
| Peak Processing Power | 1 GFlops | 100 GFlops | 1 TFlops | 7 TFlops |
Architecture Design Tradeoffs
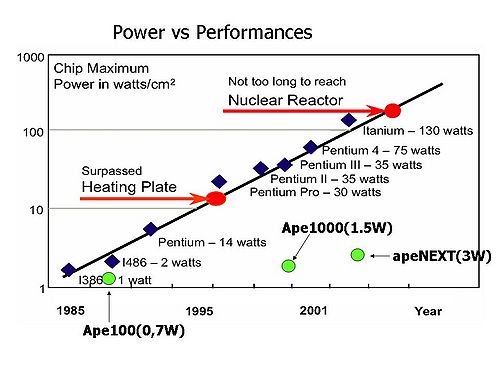
As pointed before one of the most critical issue for the design of the next generations of high performance numerical applications will be the power dissipation. A typical figure is the power dissipation per unit area. The following picture illustrates the efficiency of the approach adopted by INFN:
On the other hand the most limiting factor of processing nodes density is the inter-processor bandwidth density. In the traditional approach, used in top computing systems as INFN apeNEXT and IBM BlueGene/L, the inter-processor connections use a 3-D toroidal point-to-point network. In these systems the limiting factor of the density of processing nodes is the connectors’ number and related surface area required to implement such networks. The physical implementation is realized distributing the set of motherboard connectors on its 1-D edge using a backplane to form a multi board system.
As a consequence the density of processing nodes per motherboard is 16 nodes for apeNEXT and 64 nodes per BlueGene/L, while the density per rack is equal to 512 nodes for apeNEXT and 1024 for BlueGene/L.
Lattice QCD
QCD (Quantum Chromo-Dynamics) is the field theory which describes the physics of the strong force, ruling the behavior of quarks and gluons. In general, the solution of the theory is not possible through pure analytical methods and requires simulation on computers. LQCD (Lattice-QCD) is the discretized version of the theory and it is the method of choice. The related algorithms are considered as one of the most demanding numerical applications. A large part of the scientific community which historically worked out the LQCD set of algorithms is now trying to apply similar numerical methods to other challenging fields requiring Physical Modelling, e.g. BioComputing.
Up to now, LQCD has been the driving force for the design of systems like QCDSP, QCDOC (Columbia University), CP-PACS (Tsukuba Univerity) and several generations of systems designed by INFN (APE family of massively parallel computers).
Present simulations run on 4-D (643x128) physical lattices, and are well mapped onto a 3D lattice of processors. On a 10+ year scale, theoretical physics will need to grow to 2563x512 physical lattices.
Since the required computational power scales with the seventh power of the lattice size, PETAFlops systems are needed.

